
The Brief
- India’s latest complete annual employment estimate puts women workers aged 15 and above at 20 crore in 2025. This is broader than paid or salaried employment.
- The latest monthly snapshot, September 2026, records female labour force participation at 34.6%. Its weekly reference period makes it different from the annual usual-status measure.
- 28.3% of female workers were unpaid helpers in household enterprises in the annual report’s employment-status distribution; 18.2% held regular wage or salaried jobs.
- Average monthly earnings in regular wage/salaried employment were ₹18,353 for women and ₹24,217 for men in 2025. These are unadjusted averages across different jobs and workers.
- Progress needs to be measured through income, protection, time and advancement, alongside participation.
India’s working women in 2026: The numbers
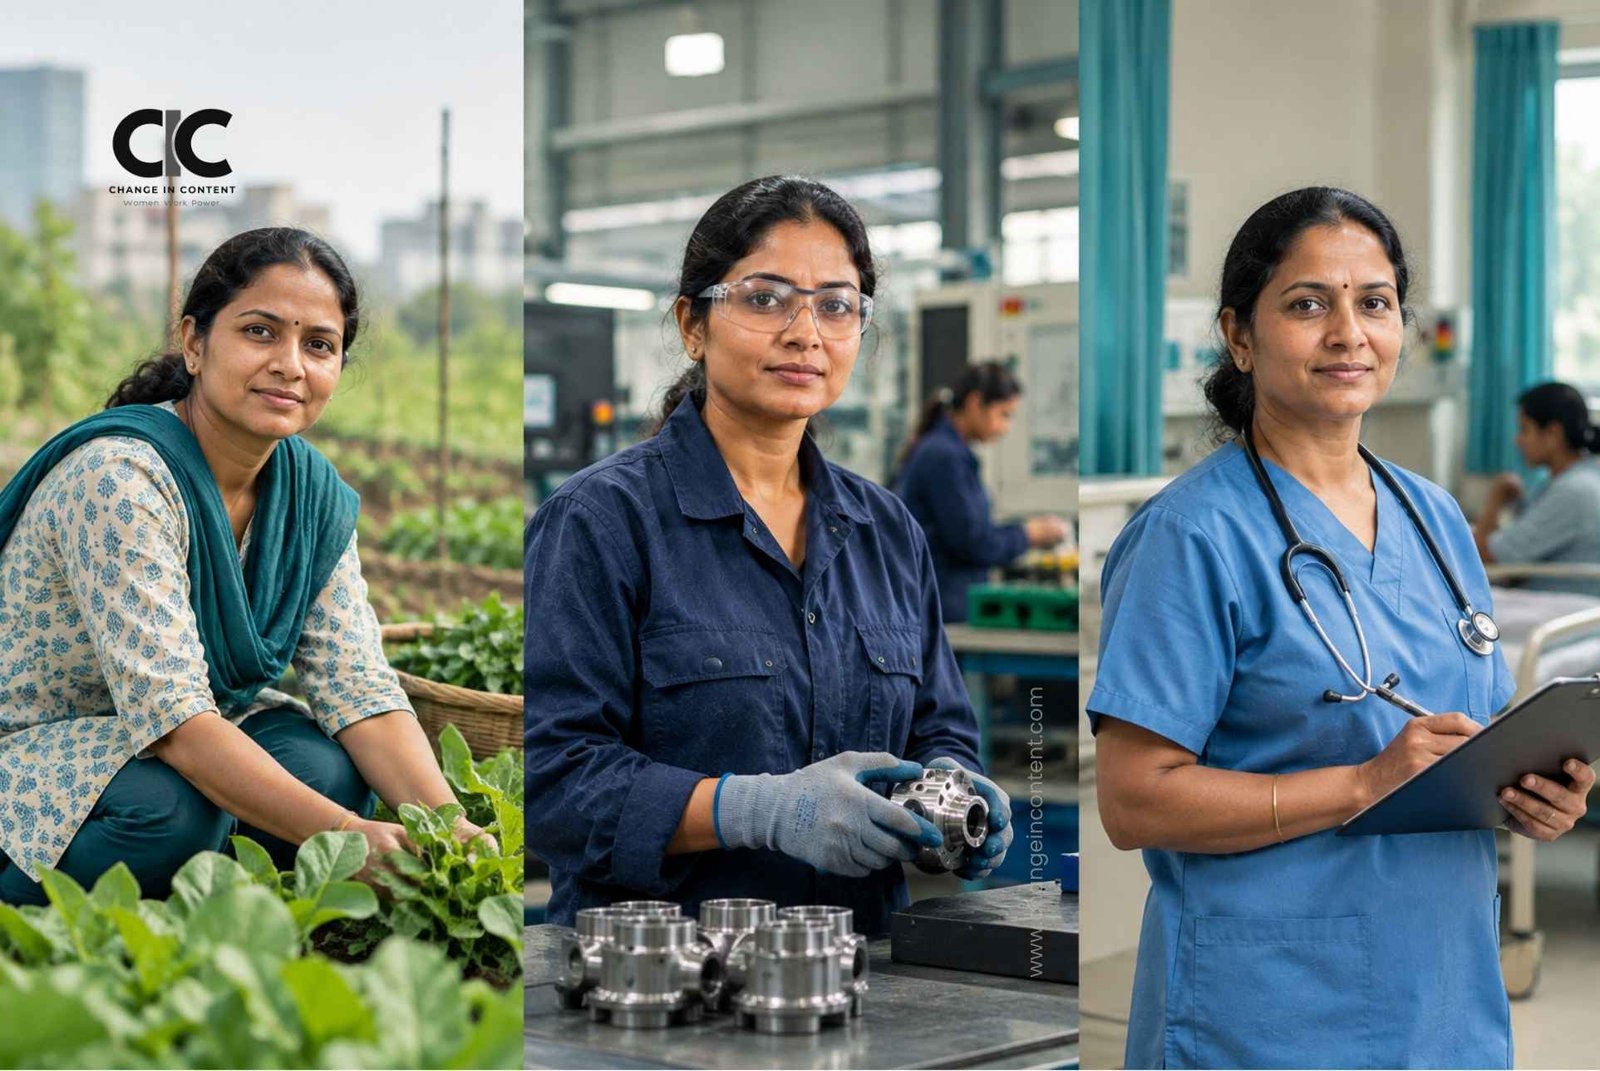
When we picture a working woman, whose working day comes to mind? A professional opening her laptop? Or a nurse beginning a shift? Or a woman harvesting a crop, running a small shop or helping keep a family enterprise alive?
All belong in this conversation. Their working arrangements, however, can offer very different degrees of security and independence. A woman receiving a salary and a woman contributing unpaid labour to a household business may both appear in employment statistics. That shared classification tells us something important about their contribution. It tells us considerably less about their control over money.
India’s working women in 2026 need to be understood through both lenses. Recognising work that has been overlooked is progress. So is asking whether the woman doing it can negotiate her pay, take time off, build savings and choose her next opportunity.
The numbers provide a more interesting story than either uncomplicated celebration or blanket pessimism. They also challenge employers, families and institutions to become more specific about what they mean by inclusion.
First, how many women work in India?
The government estimates that 20 crore women aged 15 and above were employed, on average, during January–December 2025, compared with 41.6 crore men. These estimates combine Periodic Labour Force Survey results with population projections; they are not a headcount from a census.
Three measures often get confused:
| Measure | What it asks | Women, 2025 |
| Labour force participation rate | What share of women aged 15+ were working, or unemployed and seeking/available for work? | 40.0% |
| Worker population ratio | What share of women aged 15+ were employed? | 38.8% |
| Unemployment rate | What share of women in the labour force were unemployed? | 3.1% |
Source: PLFS 2025; usual status, principal plus subsidiary activity.
A low unemployment rate cannot tell us that nearly all women have access to work. Women outside the labour force are outside that calculation. Nor does employment necessarily mean year-round work, a personal wage or a formal job.
The latest 2026 update: September’s monthly PLFS puts female participation at 34.6% and the female worker population ratio at 32.8%, both for ages 15 and above. Urban female participation was 25.9%. These use current weekly status, rather than the annual usual-status approach. Comparing 40.0% directly with 34.6% would manufacture a misleading story of decline.
The kind of work changes the meaning of the headline
Here is the composition of female employment in the 2025 annual report:
| Employment arrangement | Share of female workers |
| Own-account workers and employers | 35.9% |
| Unpaid helpers in household enterprises | 28.3% |
| Regular wage/salaried employees | 18.2% |
| Casual labour | 17.6% |
Source: PLFS 2025, Statement 7; usual-status workers, all ages. The first two categories together form self-employment, 64.2%.
That is why treating every self-employed woman as a business owner misses a substantial part of the picture. The category also includes women contributing to a household enterprise without regular individual payment.
Their contribution is economically meaningful. The question is whether recognition of that contribution is accompanied by an income they can access, a say in decisions and opportunities to develop their own work.
There is another distinction worth protecting. An unpaid helper in a family shop or farm is different from someone doing unpaid cooking, cleaning or caregiving for their own household. The latter work matters enormously, but it does not automatically qualify as employment in the PLFS. Paid domestic work is different again.
If these categories are collapsed, we lose sight of the practical changes each group needs. A salaried employee may need a fair promotion process. A contributing family worker may need a recognised role and remuneration. A small business owner may need customers, timely payment and room to invest.
The geography of work is also the geography of opportunity
Agriculture accounted for 59.8% of female workers nationally, including 72.7% in rural areas. The urban distribution looked very different.
| Sector | Share of urban female workers, 2025 |
| Other services | 40.9% |
| Manufacturing | 21.7% |
| Trade, hotels and restaurants | 16.1% |
| Agriculture | 12.7% |
| Transport, storage and communications | 4.9% |
| Construction | 3.0% |
| Mining, utilities and other listed divisions | 0.8% |
Source: PLFS 2025, Statement 8; usual-status workers, all ages. “Other services” is the survey’s broad category, not a synonym for corporate office work. Rounding can affect totals.
An inclusion strategy built entirely around office attendance and video meetings will therefore reach only part of the workforce. Work on a farm, factory floor, hospital ward or shop counter requires its own arrangements: reliable schedules, appropriate facilities, safe travel and a workable response when care responsibilities interrupt the day.
The urban picture contains an encouraging detail: 50.9% of urban female workers held regular wage/salaried jobs, compared with 9.3% of rural female workers. Yet this describes the women already working. It does not mean half of all urban women have salaried jobs.
Access and job composition need to be read together. Otherwise, a relatively favourable employment mix among a smaller group of participants can obscure how many women remain outside the labour market.
The participation rise was real, and uneven
Across the earlier comparable annual series, female labour force participation for ages 15 and above rose from 23.3% in 2017–18 to 41.7% in 2023–24. Rural participation increased from 24.6% to 47.6%; urban participation rose from 20.4% to 28.0%.
That is an increase of 23 percentage points in rural areas, against 7.6 points in urban areas. Urban participation did improve. Describing it as completely unchanged would erase that movement. Its improvement was nevertheless much smaller.
These figures establish where the measured rise was stronger. They do not, by themselves, establish how much came from improved opportunity, household financial pressure, changes in recognition of work or other influences. Claims that every additional worker represents either empowerment or distress go beyond what this trend can prove.
There is also a break in the series. The PLFS was redesigned from January 2025, and annual reporting moved from July–June to January–December. We therefore show the earlier trend separately from the 2025 profile and the 2026 monthly update.
For employers, the useful response is to investigate the local conditions behind recruitment and retention.
- Which jobs are available within a workable commute?
- Which schedules are predictable?
- Which candidates can attend training without losing a day’s earnings?
Those questions turn a national ambition into decisions that can be acted upon.
What do women earn, and what does the gap actually show?
The revised 2025 annual report provides three different earnings measures:
| Work category and measurement period | Women | Men | Women’s average below men’s* |
| Regular wage/salary: preceding calendar month | ₹18,353 | ₹24,217 | 24.2% |
| Self-employment: gross earnings over the last 30 days | ₹6,374 | ₹17,914 | 64.4% |
| Casual labour, excluding public works: per day | ₹324 | ₹489 | 33.7% |
Sources: PLFS 2025, Statements 11–13, current weekly status. Calculations: (men’s average − women’s average) ÷ men’s average. Self-employment averages exclude zero/not-reported earnings cases.
These are unadjusted earnings gaps. They do not compare identical roles, qualifications, seniority, hours or locations. The self-employment figure is gross earnings, not a guaranteed monthly salary or a clean measure of business profit. It must not be presented as the average income of every self-employed woman.
Those qualifications make the analysis more useful. They show why employers need to examine more than a single organisation-wide pay-gap number. Starting pay, job allocation, access to higher-paid specialisms, working hours and promotion decisions can all affect what women eventually take home.
An employer should investigate whether people doing comparable work receive comparable remuneration. It should also investigate who gets the opportunity to enter that work. Correcting a salary discrepancy cannot, on its own, solve unequal access to the roles with the strongest earnings potential.
A salary is not the same as security
Among female regular wage/salaried employees in non-agricultural work in 2025:
- 57.2% had no written job contract.
- 45.9% were not eligible for paid leave.
- 55.2% were not eligible for any of the social security benefits specified in the survey.
Source: PLFS 2025, Statement 10; usual status. These groups overlap and must not be added together.
Regular pay can make an important difference to a household. But if taking time off means losing earnings, or employment terms are unclear, its predictability has limits.
That is also why “salaried”, “formal” and “office-based” should never be treated as interchangeable. The national data do not provide a neat single count of women with secure corporate careers.
For businesses, the practical audit should extend to the people who keep the workplace running through contractors and service providers. Clear terms, understandable payslips, usable leave and access to grievance mechanisms should be visible in everyday experience. Our discussion of workplace safety for women in 2026 explores why that responsibility follows the work beyond the office gate.
The working day begins before the paid shift
India’s Time Use Survey 2024 helps explain the pressure on women’s available time. Among participants aged 15–59 doing unpaid domestic services for household members, women spent an average of 305 minutes a day, compared with 86 minutes for men. These are averages among people doing that activity, not among all adults or employed people alone.
The finding should change how we discuss availability. A longer commute or an unpredictable shift can compete with essential work already assigned within the household. Calling the resulting decision a simple lack of ambition tells us very little.
Workplace flexibility needs to fit the job. For someone whose tasks can be done remotely, it may mean fewer compulsory journeys. For someone working on-site, it may mean advance notice of shifts, a reliable shift-swap process or training delivered during paid hours. Working from home also needs boundaries; it does not automatically redistribute care.
Families have a direct role. Sharing routine domestic responsibilities makes time available for paid work, learning and rest. Employers can make schedules more workable, but they cannot substitute for that redistribution inside the home.
Representation at the top remains a separate test
In Russell Reynolds Associates’ analysis of 200 leading NSE-listed companies, excluding wholly or partly government-owned enterprises, women held 20% of board seats in 2025, compared with 21% in 2024. The data were collected in October 2025 and published in January 2026.
That is a defined company sample, not the share of all Indian leaders who are women. Board membership also differs from running a business unit, managing a major budget or holding an executive role.
The implication is straightforward: entry-level hiring and leadership opportunity need separate measures. Employers should follow who receives sponsorship, commercially important assignments and first promotions, alongside who enters the organisation.
Our earlier coverage of the Women in the Workplace Report 2025 examines those questions of advancement; its international corporate findings should remain distinct from this national employment picture.
What meaningful progress should look like next?
The next stage needs a broader scorecard, with responsibility attached to each part:
| Priority | A practical action | What to track |
| Access | Match recruitment, transport and schedules to local constraints | Applications, offers and joining rates by gender and job |
| Earnings | Review comparable-role pay and access to better-paid work | Starting pay, progression and adjusted pay differences |
| Security | Make employment terms, leave and benefits understandable and usable | Coverage and actual take-up, including contracted work |
| Retention | Discuss scheduling and care constraints before resignation | Retention after care leave and reasons for exits |
| Advancement | Allocate stretch assignments and sponsorship transparently | Promotion rates, budgets managed and succession opportunities |
| Independence | Recognise and remunerate work in family enterprises | Individual payment, decision-making and access to business resources |
These are proposed actions, not claims that any single intervention guarantees a national increase in participation. Their value is that they make inclusion observable. A manager can check whether a rota was issued on time. A business can examine promotion decisions. A household can decide who will handle tomorrow’s care work.
What the numbers still cannot settle
National averages conceal differences between states, districts, social groups, ages and disability experiences. Sector totals cannot tell us whether a woman feels safe at work, controls the money she earns or has a credible path to advancement. Small survey movements also deserve caution rather than dramatic causal explanations.
The statistics used here have different populations and reference periods. Participation rates and the headline worker estimate concern ages 15 and above; the employment-composition tables cover workers of all ages.
The time-use comparison covers activity participants aged 15–59. The board study covers a particular corporate sample. They describe different parts of the story and should not be multiplied together to manufacture a single precise estimate.
India has a substantial contribution to recognise and more opportunity to build. The useful question for 2026 is what changes for a woman once her work is counted: what she earns, what she can rely on, and how much room she has to decide where her working life goes next.
Frequently asked questions
Q: How many women work in India?
A: The latest complete annual estimate is 20 crore women aged 15 and above in 2025, under the usual-status measure. It includes work beyond salaried employment. A complete annual 2026 estimate is not yet available at this article’s research date.
Q: What is India’s female labour force participation rate in 2026?
A: The September 2026 monthly estimate is 34.6% for ages 15 and above, using current weekly status. It includes employed women and unemployed women seeking or available for work.
Q: Where do most working women work?
A: Agriculture accounted for 59.8% of female usual-status workers in the 2025 annual report. Urban women’s employment was more concentrated in services and manufacturing.
Q: Does being counted as employed mean receiving a salary?
A: No. Employment includes self-employment, unpaid help in household enterprises and casual labour, as well as regular wage/salaried work.
Sources and editorial verification
- MoSPI/PIB: PLFS Annual Report 2025 launch release, 27 March 2026. Used for age-15+ population estimates, headline indicators and survey redesign. Do not use this release’s casual-wage figures: the revised full report differs.
- MoSPI/PIB: September 2026 monthly PLFS, released 15 October 2026. Latest monthly release checked as of 27 October 2026.
- MoSPI: revised PLFS Annual Report 2025. Statements 7, 8, 10, 11, 12 and 13. Casual earnings use Statement 12: ₹489 for men and ₹324 for women. Status/industry distributions retain the source’s all-age worker base. No unverified salaried-worker headcounts have been calculated from the 15+ total.
- MoSPI/PIB: PLFS 2023–24, historical annual tables. Table 1, usual-status LFPR, ages 15+; July–June periods. Historical chart ends at 2023–24 because the design changed in 2025.
- MoSPI/PIB: Time Use in India 2024, detailed release. Domestic services, minutes per participant aged 15–59. Do not substitute the 6+ age-group figures or describe these as all-worker averages.
- Russell Reynolds Associates: 2025 India Board Analytics & Insights, 5 January 2026. TOP 200 NSE sample excludes public sector enterprises; data collected October 2025.
