The Brief
- This is the first district-level release under the redesigned PLFS.
- Female participation varies sharply across the selected districts.
- Participation includes employment and seeking or being available for work.
- High employment alone cannot establish good pay or financial independence.
- Local action should address access to work and the quality of that work.
First-ever district-level jobs data
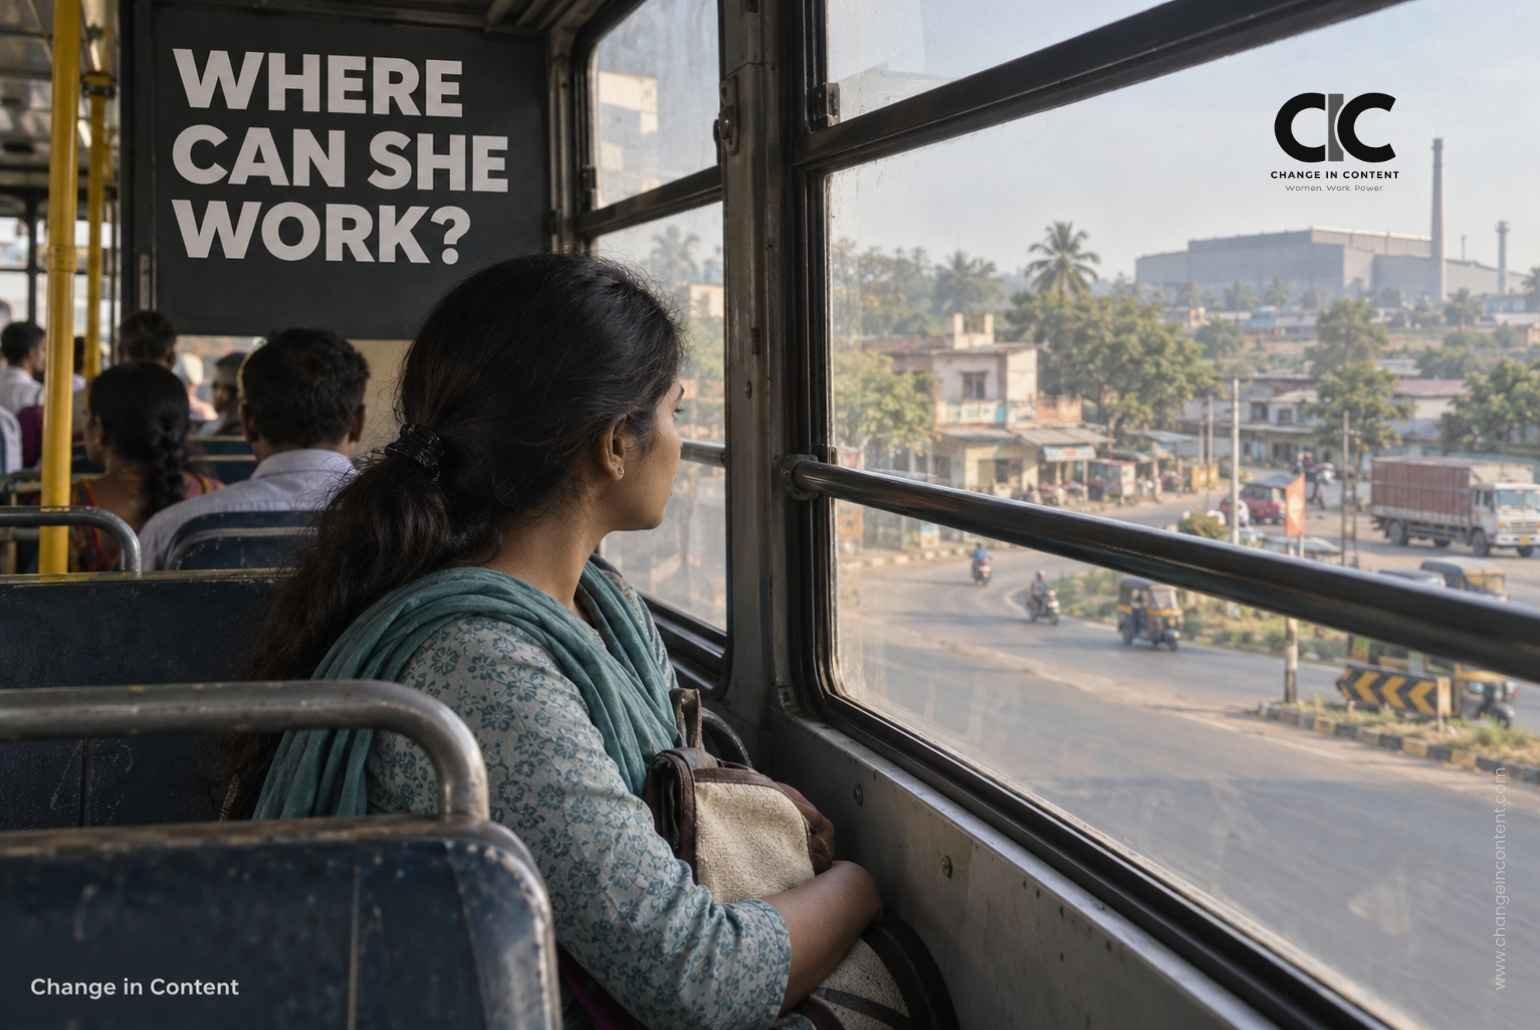
For a woman considering a job, the relevant labour market may extend only as far as a workable bus route or an affordable room. India’s first-ever district-level jobs data under the redesigned Periodic Labour Force Survey (PLFS) invites a closer look at that local reality.
Released by the National Statistics Office on 18 September 2026, the snapshot reports female labour force participation of at least 40% in 57.8% of districts. That is a share of districts, not of India’s women. (MoSPI release.)
For employers and policymakers, these figures offer a starting point for better questions. Where are women finding work? What kind of work is it? And what would allow women currently outside the labour force to consider entering it?
Read the district comparison carefully
Selected figures from the official comparison show the scale of variation:
| District | Female labour force participation rate | Female worker population ratio |
| Hamirpur, Himachal Pradesh | 80.9% | 80.0% |
| Mayurbhanj, Odisha | 71.8% | 71.2% |
| Patiala, Punjab | 39.3% | 35.8% |
| East Delhi, Delhi | 18.9% | 15.7% |
Source: MoSPI, Table 4. Women aged 15 and above; usual status. The table selects leaders from each state’s ten largest districts by female population. These are not national best-and-worst rankings.
Two measures need separating. Labour force participation rate (LFPR) includes people working, seeking work or available for work, as a share of the relevant population. Worker population ratio (WPR) counts those employed. Neither describes women’s share of all workers. The usual-status approach assesses activity over the 365 days preceding the survey. (PLFS concepts and definitions.)
An employment percentage also leaves important questions unanswered. A woman’s earnings, control over those earnings and prospects of progression require separate attention. That is why the discussion about unpaid family work and women’s self-employment belongs alongside participation figures.
Being counted as employed does not tell the whole story
PLFS employment categories include helpers in household enterprises who receive no regular wage or salary. Ordinary unpaid domestic duties in one’s own household are treated differently and do not, by themselves, count as employment. MoSPI’s survey instructions make that separation clear.
Consider two hypothetical situations. One woman helps run a family shop without a regular wage. Another spends her day caring for relatives and managing her household, without a job or availability for one. Both work hard. Their statistical classifications differ because the survey measures particular forms of economic activity.
Consequently, a high participation figure should prompt questions about remuneration and working conditions. A low figure calls for investigation into available opportunities and the reasons women are outside the labour force. Neither number supports a judgement about women’s ambition.
There is relevant national evidence on care. In its separate annual PLFS 2025 release, MoSPI reported that 44.4% of females outside the labour force cited childcare or personal commitments in homemaking as their main reason. This provides context; it does not establish why any particular district has its reported rate. (PLFS annual release.)
What should employers do with a local picture?
Our recommendation is to investigate the journey from an available role to a sustainable job. Employers could compare applications, offers, joining and retention across their locations, then ask women directly where the process breaks down.
The district rate can guide those conversations; it cannot replace them.
- If candidates decline shifts that finish after the last bus, test a transport solution.
- If childcare is the recurring obstacle, examine whether provision matches working hours.
- If relocation is required, assess the cost and availability of safe accommodation near work.
These are possible interventions to investigate locally, not explanations established by the district tables.
District administrations could bring employers, transport providers, training institutions and women’s groups into the same planning process. Before commissioning another course, establish which jobs are available, what they pay and whether trainees can realistically take them. Employers should then report joining and retention outcomes, rather than stopping at the number trained.
Any comparison needs statistical care. MoSPI warns about sampling variability, relative standard errors and district-boundary changes. It advises against comparison with earlier NSS-region-based estimates. Small numerical differences should therefore not become sweeping claims about district performance.
Change in Practice
The value of a local employment picture will depend on what follows it. A district with high participation still needs to ask whether women can earn reliably and progress. A district with low participation needs to understand the obstacles women themselves identify, including whether suitable jobs exist at all.
For Change in Content, the practical test is whether this information leads to a better employment offer: accessible work, worthwhile earnings and conditions that allow women to stay. Publishing a league table would be easier. Building that offer would be more useful.
Editorial Note
This original analysis uses MoSPI’s official district snapshot release of 18 September 2026, its PLFS 2025 annual release and survey definitions, checked on 22 September 2026. The district figures were verified against the official release; the full district bulletin was not independently accessed. “First-ever” refers here to district estimates under the redesigned PLFS, not the first district employment statistics from any source. The examples are hypothetical, and the recommendations are editorial analysis. No interviews were conducted, and no causal explanation for an individual district is claimed.
Sources
- Ministry of Statistics and Programme Implementation: Labour Market Snapshot of Selected Districts, 18 September 2026. District figures, comparison groups and methodological cautions.
- Ministry of Statistics and Programme Implementation: Periodic Labour Force Survey Annual Report 2025: official release, 27 March 2026. Definitions and national context on reasons for being outside the labour force.
- Ministry of Statistics and Programme Implementation: PLFS Instructions to Field Staff, Volume I, sections 1.5.10–1.5.13 and 3.7. Employment categories and treatment of household enterprise work and domestic duties. Used for concepts, not current district estimates.