The Brief
- Women exceed half the workforce in four of the 18 industries measured.
- Healthcare and care services lead, followed by education.
- The figures are LinkedIn-based averages across 61 economies, through June 2026.
- Six other sectors feature in the displayed top ten without reaching a female majority.
- Representation deserves recognition; pay, progression and working conditions require separate evidence.
A hospital ward, a classroom and a public-service office have something in common in this dataset: women make up more than half their industry’s workforce. But the list of industries with more women than men is shorter than a recent headline suggests. There are four, rather than ten, among the 18 industries measured.
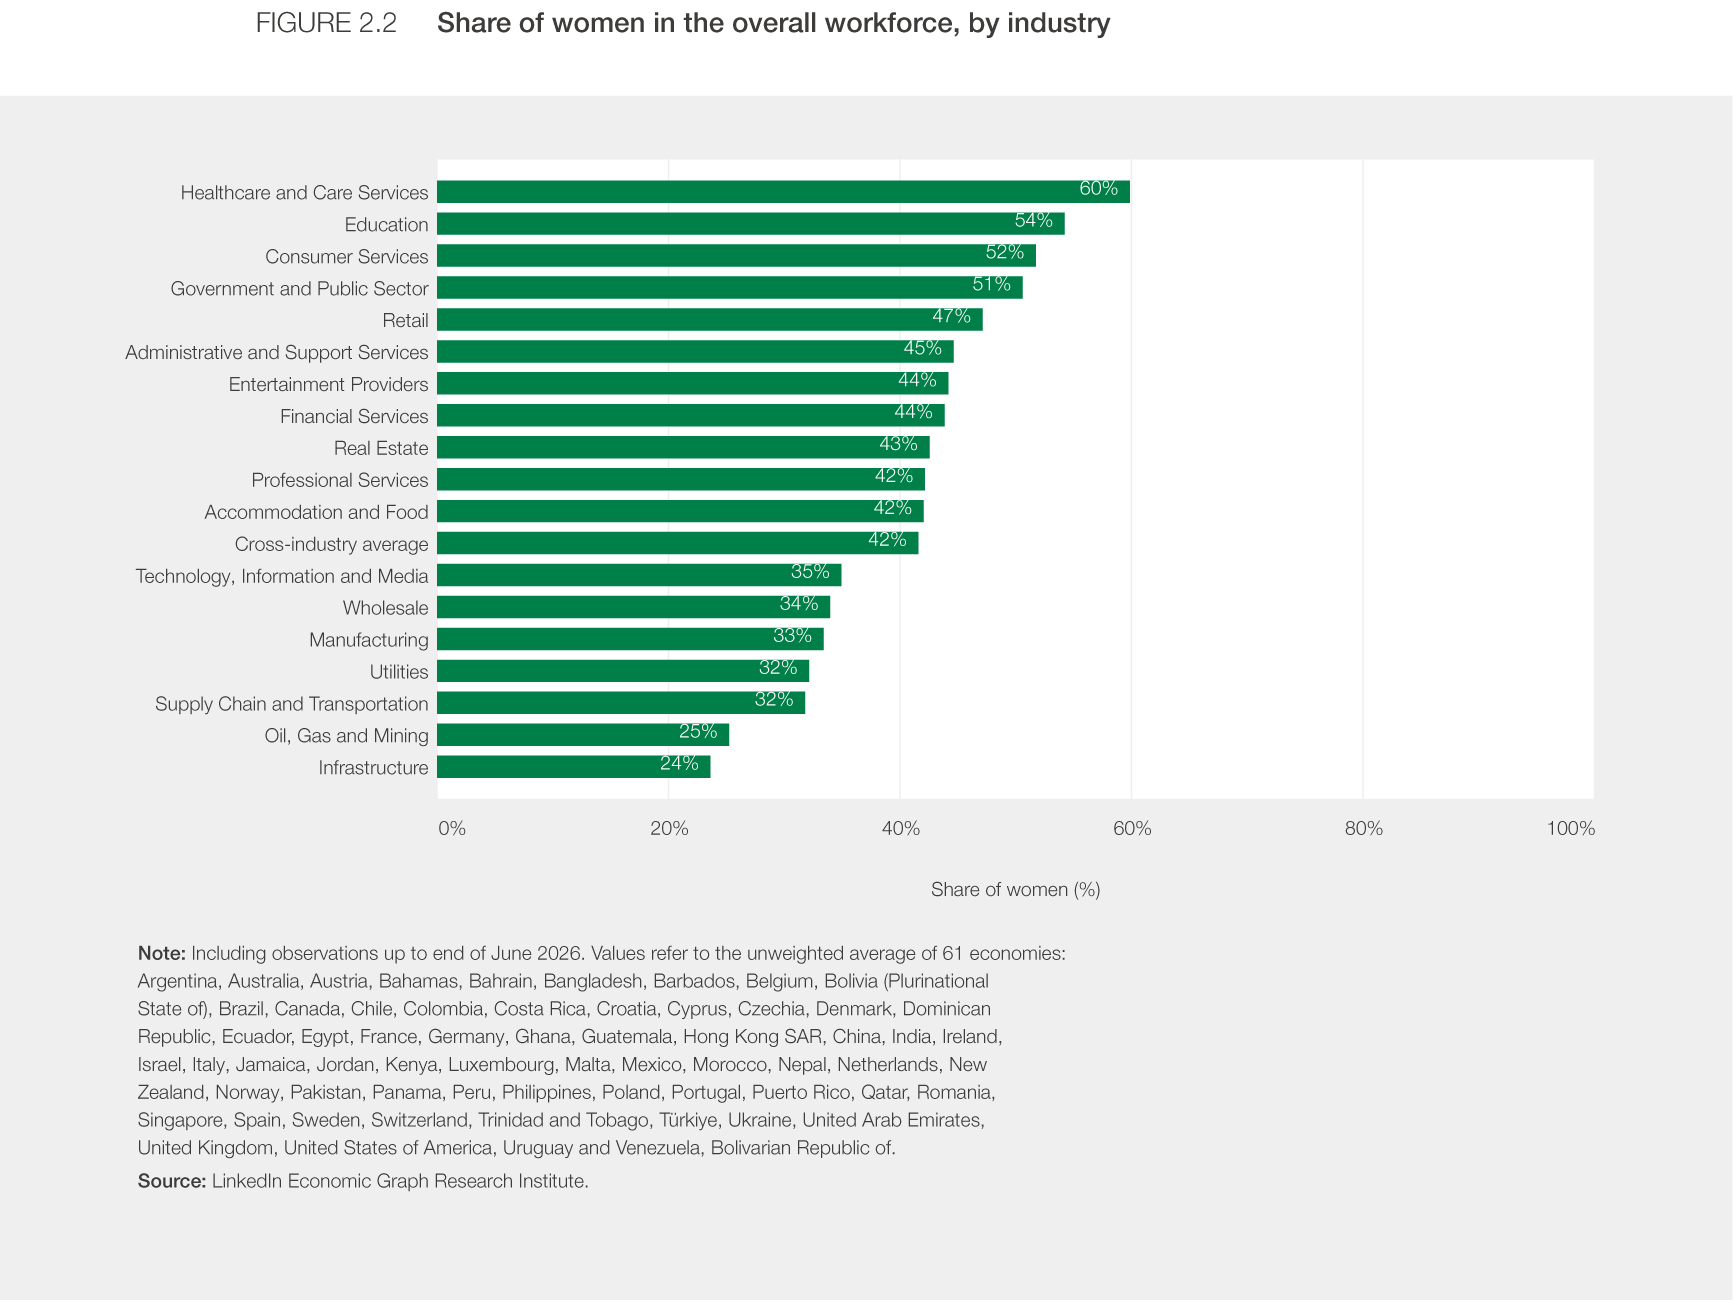
Visual Capitalist’s ranking, published on 16 October, brings attention to findings from the World Economic Forum’s Global Gender Gap Report 2026, using LinkedIn Economic Graph Research Institute data. We have checked the ranking against WEF’s industry chart.
The result is worth exploring. Women’s work sustains services, institutions and businesses well beyond the familiar corporate leadership photograph. A high share also creates an opportunity for employers to show how participation translates into valued, well-supported careers.
Industries with more women than men: Read the ranking correctly
The industry figures are unweighted averages across 61 economies, including observations through June 2026. They are not an India-only ranking or a census of every worker worldwide. LinkedIn-based data should not be assumed to represent informal work and every occupation equally.
Percentages below follow the published whole-number presentation. WEF’s accompanying text gives the four majority sectors as 59.9%, 54.2%, 51.7% and 50.6%, respectively. The numbers describe workforce composition, not female ownership, executive representation or an employer’s inclusion performance.
This is an industry lens, not an endorsement of every organisation within it.
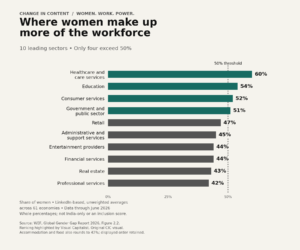
Figure 2.2. Ranking highlighted by Visual Capitalist; original CIC visual. Accommodation and food also rounds to 42%.
Source: WEF, Global Gender Gap Report 2026, Figure 2.2; ranking highlighted by Visual Capitalist. Display order is retained. Accommodation and food, shown immediately below professional services, also rounds to 42%; equal rounded values do not establish an exact tie or a clear gap.
1. Healthcare and care services: 60%
Clinical judgement, treatment, rehabilitation and continuing care all demand skilled work. The leading share gives women’s contribution a clear place in the economic picture, rather than treating care as an instinct that needs little recognition or investment.
A progressive employer would examine staffing, safe shifts, professional development and routes into decision-making. The percentage alone cannot tell us whether those conditions are present. Nor should recognition of women’s contribution narrow anyone’s view of which careers women can pursue.
2. Education: 54%
Teaching combines subject knowledge with assessment, communication and the judgement needed to help different learners progress. A female majority highlights women’s substantial presence in the institutions that prepare others for work and public life.
The useful follow-up is whether women can advance into academic and institutional leadership, with fair access to research time and development. The wider discussion of education and women’s access to employment also reminds us that qualifications and sustained careers need a connection.
3. Consumer services: 52%
Consumer services sits just above the halfway mark. Its broad label should not be read as a single occupation, or merged with retail and accommodation and food, which the ranking lists separately.
For employers, customer-facing skills deserve a proper account: resolving difficult situations, retaining trust and maintaining service standards can carry commercial value. Progress would mean recognising that expertise in pay and advancement, while setting clear boundaries around unacceptable customer behaviour.
4. Government and public sector: 51%
Women’s presence in public employment matters because public institutions deliver services and put policy into practice. The industry average, however, says nothing by itself about women’s share of elected offices, cabinet positions or the highest administrative ranks.
A useful assessment would look within institutions: who has supervisory authority, who receives development opportunities, and whether transfer and deployment arrangements are workable. A near-balanced workforce is a meaningful starting point for examining those questions.
5. Retail: 47%
Retail comes close to parity in the displayed figures, although women remain below half. The work can involve customer advice, merchandising, inventory judgement and day-to-day commercial decisions.
To assess an individual retailer, look beyond the overall staffing ratio. Predictable hours, safe closing arrangements and a clear route from store roles into management would offer more useful evidence of inclusion. Frontline knowledge should also have a route into decisions about products, processes and customer experience.
6. Administrative and support services: 45%
Keeping an organisation functioning takes coordination, scheduling, service continuity and the ability to solve problems before they spread. The category’s name should not encourage employers to regard every contribution as routine.
The practical question is how that work enters performance and career discussions. Accurate recognition of women’s contributions should explain the judgement involved and connect it to development, rather than leave an employee permanently described as helpful.
7. Entertainment providers: 44%
The entertainment industry draws attention to performers, but assessing opportunity requires looking beyond the people audiences see. Technical, operational and decision-making work deserves attention too.
This category should not be treated as interchangeable with the separately listed technology, information and media industry. For an employer or commissioning organisation, useful inclusion questions concern transparent selection, clear contracts, timely payment and access to consequential creative responsibilities. A workforce share cannot answer those questions on its own.
8. Financial services: 44%
Financial services offers a particularly useful reason to examine the distribution of responsibility. An industry-wide percentage cannot show who manages capital, approves risk or leads revenue-generating business.
Women’s contribution across the sector deserves recognition without assuming that every function offers the same prospects. Employers can make the picture clearer by publishing representation across grades and functions, then examining access to major accounts, technical training and commercial leadership assignments.
9. Real estate: 43%
Real estate appears separately from infrastructure in this classification. The figure should therefore not be described as the proportion of women on construction sites.
Within a real-estate business, an inclusion review could examine access to clients, negotiations, commissions and responsibility for valuable transactions. It should also consider the practical conditions of property visits and travel. These questions make the category useful to readers assessing an employer, rather than simply admiring its position in a ranking.
10. Professional services: 42%
Professional services completes the displayed ten-sector selection. Here, too, the overall share leaves open important questions about who wins major assignments and who receives credit for bringing in or retaining clients.
For employers, progress can be demonstrated through clear promotion standards and fair access to work that builds expertise and responsibility. Understanding the connection between workplace conditions and career progression helps make that assessment more meaningful than a headcount alone.
The Change Worth Counting
These industries show the breadth of women’s economic contribution. Their work deserves visibility, professional respect and investment. A strong female presence can also give employers a substantial base of experience from which to develop future leaders.
Calling an industry progressive requires more evidence than this ranking supplies. The better question for a company is what women can build there: a dependable income, recognised expertise, a sustainable working life and a fair opportunity to influence decisions. That is where a representation figure becomes a more complete story of inclusion.
Editorial note and sources
This listicle credits Visual Capitalist for highlighting the ranking and uses WEF’s original chart and accompanying text to check the figures and scope. Figures were reviewed on 19th October 2026. All percentages and the displayed order are retained, with rounding at the cut-off disclosed. Industry examples and employer questions are CIC’s editorial interpretation, not findings about every business in each sector. The data does not establish India-specific shares or certify employers as inclusive.
- Visual Capitalist — Ranked: Which Industries Have More Women Than Men?, 16 October 2026.
- World Economic Forum — Global Gender Gap Report 2026: Trends and Pathways Shaping the Future of Parity.
- WEF Figure 2.2 — Share of women in the overall workforce, by industry; source: LinkedIn Economic Graph Research Institute.