
The Brief
- The Global Gender Gap Report 2026 finds that 69.2% of the global gender gap has now been closed across the 145 economies included in this year’s index, up 0.4 percentage points from 2025.
- Across the 97 economies included in every edition since 2006, parity has improved from 64.2% to 69.4%, the highest level recorded in the 20-year series. At that pace, the World Economic Forum estimates full parity remains 120 years away.
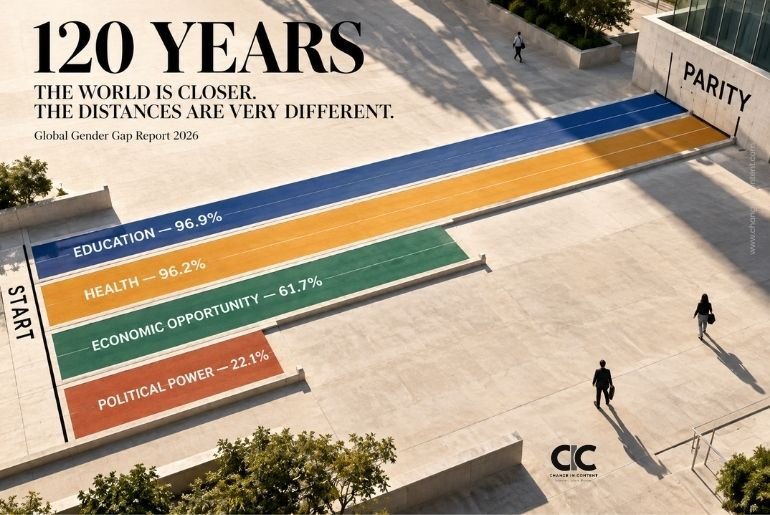
- Progress is highly uneven. Educational Attainment is 96.9% closed and Health and Survival 96.2%, while Economic Participation and Opportunity stands at 61.7% and Political Empowerment at only 22.1%.
- Women account for 46% of entry-level workers but only 23% of the C-suite. Women’s representation in senior leadership has reached 29.6%, but recent progress has stalled.
- AI could create a new gender gap inside a new economy. Women make up nearly half of data annotators but only around one-fifth of AI developers and deployment engineers.
The Global Gender Gap Report 2026
120 Years is a strange number.
It is too long to feel like a conventional policy target. Too long for a career. Way too long for a working life. Long enough for several generations to live through the consequences of the pace we choose today.
And yet 120 years is the figure sitting at the centre of the Global Gender Gap Report 2026, released by the World Economic Forum on September 16.
There is another number beside it that deserves equal attention. 69.2%. That is how much of the global gender gap has now been closed. It is the highest level the index has recorded.
Those 2 numbers belong together. Because the 2026 report is neither a story of failure nor a victory lap. It is a 20-year record showing that the world can move towards parity. And that it is still moving far too unevenly.
First, what does 120 years actually mean?
It is worth clearing up one possible misunderstanding immediately. The World Economic Forum is not predicting that gender equality will suddenly arrive in 2146.
The 120-year figure is an estimate based on the historical rate at which the 97 economies continuously tracked across all 20 editions have closed their gender gaps.
If that pace changes, the timeline changes.
Last year, the comparable global estimate was 123 years. This year it is 120. So 3 years have effectively been shaved off the projected wait. That is progress. It is also a useful perspective on how slowly the clock moves.
The 120-year figure should therefore be read less as a forecast and more as a measure of speed. And speed is something policy, business, technology and social change can alter.
20 years actually did change a great deal
The report deserves to be read across its full two-decade history.
When the index began in 2006, the 97 economies that have remained continuously in the dataset had collectively closed 64.2% of their gender gap. In 2026, they have closed 69.4%. That is a 5.2-percentage-point improvement.
More broadly, virtually every economy continuously tracked over the period has improved its overall parity score.
The first decade moved faster than the second. The pandemic produced substantial setbacks. Since 2024, more than half of the long-term cohort has regained momentum. That history matters.
Gender gaps are not immovable. The data shows they have moved. What the report also shows is that progress has been concentrated much more heavily in some parts of life than others.
Education is almost there. Economic power is not.
Perhaps the cleanest way to read the report is through its four dimensions.
In 2026:
- Educational Attainment: 96.9%
- Health and Survival: 96.2%
- Economic Participation and Opportunity: 61.7%
- Political Empowerment: 22.1%
The gap between those numbers is enormous. A girl can increasingly receive education comparable to a boy. That does not guarantee that, 20 years later, she will have comparable:
- income;
- leadership authority;
- access to capital;
- economic mobility;
- or political power.
That may be one of the most important findings in the entire report. The global gender-parity challenge is increasingly shifting from access towards power.
Women have made enormous gains in entering schools, universities and labour markets. The unfinished work is much more about who advances, earns, owns, leads and decides.
Our recent Gender Equality Concepts guide makes this distinction useful: representation, participation, equality and power are related, but they are not interchangeable.
The economic gap could take 129 years
The World Economic Forum estimates that, at the historical pace recorded across the long-term cohort, Economic Participation and Opportunity could take another 129 years to reach parity.
There has been movement. Across the 20 editions, the economic-parity score for continuously tracked economies increased from 55% to 61.1%. But economic parity is complicated because being economically present is not the same as possessing equal economic opportunity.
The 2026 report increasingly looks beyond whether women simply have jobs. It asks where they are within the economy.
- Are they in resilient occupations?
- Are they progressing?
- Are they entering high-value industries?
- Are they receiving leadership responsibility?
- Are they directing capital?
Those questions matter because the economy itself is changing. And new opportunity does not necessarily begin with an equal gender distribution.
The leadership funnel remains one of the clearest gaps
The report incorporates LinkedIn Economic Graph data that we recently examined separately at Change in Content.
- Women account for 46% of entry-level workers.
- At the C-suite, that falls to 23%.
- Women’s overall workforce representation increased from 39.9% in 2015 to 41.8% by June 2026.
- Representation in senior leadership rose from 26.7% to 29.6% over the same period.
But recent hiring and leadership gains have stalled, with signs of decline since 2022. This makes leadership an increasingly important part of the parity question.
A workforce can become more balanced at entry level without power becoming equally distributed at the top. And, as the report notes, women remain particularly underrepresented in executive roles that frequently serve as routes to CEO positions.
That is why the next phase of corporate inclusion has to examine progression, not merely recruitment.
AI could build tomorrow’s inequality surprisingly quickly
This is where the 2026 report becomes especially contemporary.
AI is creating new occupations, new companies, new sources of productivity and potentially enormous new economic value. Women are participating. But participation differs dramatically depending on where in the AI value chain we look.
The Forum reports that women make up nearly half of data annotators, but only around one-fifth of developers and deployment engineers.
That matters because AI roles are not economically equivalent. Some involve labelling and preparing data. Others involve building infrastructure, developing models, deploying systems and making technical decisions over how AI is used.
A new technology can therefore appear broadly accessible while authority and higher-value technical opportunity concentrate elsewhere.
Our earlier piece on women and the AI jobs boom examined another part of this problem: LinkedIn data showed women receiving only 26% of US AI hires in 2025 and occupying only 13% of C-suite AI leadership positions across the countries studied.
The concern here is not that AI has already permanently reproduced the gender gaps of the old economy. It is that this is precisely the moment when those patterns can still be prevented from hardening.
Entrepreneurship is growing. The gender share is not.
Another future-facing number deserves attention.
LinkedIn data incorporated into the report shows that the number of workers adding “founder” to their profiles jumped 60% between 2024 and 2025. Women’s share of founders, however, remained around 28%.
There is also an emerging AI-skills difference among entrepreneurs: 14.7% of male founders list AI engineering skills, compared with 8.7% of women founders.
That tells us something bigger than whether more women start companies. It concerns which founders will be best positioned to use one of the technologies increasingly shaping how companies are created, operated and scaled.
The parity question is moving into new territory very quickly.
Capital tells a similar story
Women now represent 40.4% of the workforce in capital-market institutions covered by the report’s underlying data. In senior leadership, their share falls to 31%. Meanwhile, women’s representation at the top of central banks has improved: they account for 19% of governors when regional banks are included, with women also representing 29% of senior staff.
The direction is positive. The distance remains considerable. And capital matters because this is where gender representation begins intersecting directly with who decides where money goes.
Economic power is not captured fully by workforce participation. It also lives in investment decisions, credit allocation, budgets and ownership.
Political empowerment presents the most difficult timeline
Political Empowerment has recorded the largest improvement over the full 20-year history of the index.
Across the continuously tracked economies, its parity score rose by 8 percentage points. Yet it remains by far the furthest dimension from equality, and the Forum estimates 194 years to parity at the historical pace.
There is also a warning inside that long-term progress.
Political Empowerment is now lower than it was in 2016 across the long-term series. Women’s representation in parliaments has proved comparatively durable, increasing over time. But the highest levels of political power have not moved in one direction. The share of economies led by women reached a high point in 2022 and subsequently fell back to approximately its 2016 level.
And while more ministerial portfolios are held by women than in earlier decades, only around one in ten portfolios led by women is classified by the report as high-influence, based on factors including visibility, budgets, staffing and proximity to executive power.
This closely echoes our recent report on women’s political leadership losing ground. The story is not uniform regression. Parliamentary representation can improve while other concentrations of power stagnate or reverse.
Higher income helps. It does not explain everything.
There is another finding worth keeping because it prevents an overly simplistic reading of the report. Higher-income economies have higher average parity scores. But income does not determine the outcome completely.
The Forum reports considerable overlap between income groups, with several lower-income economies outperforming substantial numbers of richer ones.
Saadia Zahidi, Managing Director at the World Economic Forum, draws an important conclusion from the 20-year history: economies at every income level have made progress, meaning resources alone cannot explain the pace of parity.
That is useful because gender parity can sometimes be treated as something countries will naturally acquire once they become richer. The data suggests otherwise.
Economic development can create opportunity. How institutions, employers and governments distribute that opportunity still matters.
And this is why we are not spending much time on rankings
The Global Gender Gap Index is often reduced to a league table.
- Country A rose.
- Country B fell.
- Country C entered the top ten.
Those comparisons have value, and the World Economic Forum publishes them for a reason. But they can also distract from what this 20th edition uniquely gives us: time.
20 editions allow us to see where progress has held. Where it accelerated. Where it stalled. And where an earlier gain was later lost.
A country can move several places in a ranking because other countries moved too. A parity score tells us something more direct about the underlying gap.
For this article, the trajectory matters more than the leaderboard.
What should organisations take from a 120-year global estimate?
A company cannot fix a global index. It can influence several things that eventually appear inside one.
- Who gets hired.
- Who gets trained in AI.
- Who receives high-value assignments.
- Who moves into P&L roles.
- Whose career survives a care break.
- Who gets sponsored.
- Who enters succession planning.
- Who gets access to capital.
- And whether leadership progress is measured after women have already entered the organisation.
The report’s message for employers is increasingly less about adding another women’s initiative. It is about making sure women participate in the parts of the economy where tomorrow’s money, technology and authority are being created. Because the next gender gap is being built now. So is the opportunity to avoid it.
Change in Content View: 120 Years is the headline. The 4 gaps are the story.
There is something tempting about 120 years. It is enormous. Memorable. Perfect for a headline. But perhaps it is not the number we should leave with.
Consider these instead:
- 96.9% in education.
- 96.2% in health.
- 61.7% in economic opportunity.
- 22.1% in political empowerment.
That is what uneven progress looks like.
The world has become far more successful at bringing girls and women into systems than at distributing economic and political power equally once they are there. And that tells us where the next twenty years of work lies.
The 2026 report contains evidence that change is possible. Virtually every economy tracked consistently across its history has moved. Women have gained ground in education, work, leadership, finance and politics.
So 120 years should not be read as destiny. It is the result of a pace. And pace can change.
Editorial Note & Sources
The Global Gender Gap Index measures gaps between women and men in outcomes across four dimensions. It does not measure absolute levels of development, nor should rankings automatically be interpreted as a complete assessment of women’s lives in any economy. Data availability and collection dates also vary by indicator. Change in Content has therefore focused this article on global and long-term trends rather than country rankings. The 120-year figure is an estimate based on the historical pace of progress across the 97 economies included in every edition since 2006; it is not a prediction of an exact parity date.
Sources
World Economic Forum: Global Gender Gap Report 2026, 16 September 2026. Primary report and methodology covering 145 economies and the long-term cohort of 97 economies.
World Economic Forum: Global Gender Gap Report 2026: Key Findings. Primary source for the 69.2% global score, 120-year estimate, four subindexes, long-term trends and regional patterns.
World Economic Forum: Trends and Pathways Shaping the Future of Parity. Primary report chapter covering leadership, AI, entrepreneurship, capital markets, legal frameworks and political power.
World Economic Forum: “Twenty Years of Progress on Gender Parity Now Fragile”, 16 September 2026. Official release accompanying the report.
