
The Brief
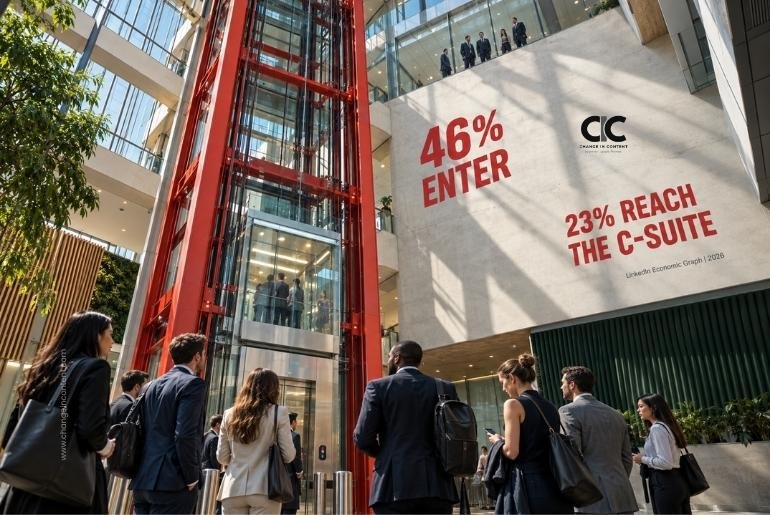
- New LinkedIn Economic Graph Data on Women’s Representation shows women accounting for 46% of entry-level workers, but only 23% of C-suite leaders across the economies studied.
- Women’s representation in top management increased from 26.7% in 2015 to 29.6% in 2023, but has remained at 29.6% for four consecutive years.
- Based on progress in the five years leading to 2020, LinkedIn had estimated leadership parity could be reached in about 50 years. Based on the slower progress since then, the estimate has widened to approximately 90 years.
- Women hold only 19% of CEO roles, 27% of CFO roles and 24% of COO roles, while they are much better represented in people, HR and communications leadership.
- LinkedIn points to accountability, sponsorship, future-ready skills and skills-based hiring as areas where employers can act.
LinkedIn’s Economic Graph Data on Women’s Representation
46%. That is close enough to parity to make the next number difficult to ignore. 23%.
According to new LinkedIn Economic Graph data, women account for 46% of people at entry level across the economies studied.
By the time the organisation reaches the C-suite, their representation has fallen by half.
For years, the corporate leadership gap has often been discussed as a pipeline problem.
The latest numbers make that explanation increasingly incomplete.
Women are in the pipeline. The question is what happens to them as the organisation moves upwards.
The most worrying number may be 29.6%
Women’s representation in top management increased from 26.7% in 2015 to 29.6% in 2023. Then it stopped.
- 2023: 29.6%.
- 2024: 29.6%.
- 2025: 29.6%.
- 2026: 29.6%.
4 consecutive years without movement. That plateau matters because slow progress and no progress are different things.
A number moving upwards by fractions of a percentage point can be frustratingly slow, but the direction remains positive.
A number that stops moving tells organisations to look harder at the machinery underneath it.
- Hiring can continue.
- Entry-level representation can remain relatively strong.
- Corporate programmes can continue.
- And leadership representation can still go nowhere.
We recently saw another version of this problem in India, where women’s representation in corporate executive roles fell to 16.7% in the 2026 Avtar–Seramount study. The datasets are different and should not be directly compared, but both point towards the same organisational question: what happens after women enter?
The climb gets narrower as the authority gets bigger
LinkedIn’s breakdown of C-suite roles makes the pattern more visible.
Women hold:
- 19% of CEO roles;
- 27% of CFO roles;
- and 24% of COO roles across the economies studied.
Now compare that with functions traditionally associated with people and communication.
Women account for:
- 65% of Chief People Officers;
- 64% of Chief Human Resources Officers;
- and 45% of Chief Marketing Officers.
There is nothing secondary about HR, people or marketing leadership.
These are consequential executive roles. But the distribution still tells us something about where women are concentrated at the top.
The positions associated most directly with enterprise control, operations and ultimate organisational authority remain substantially less balanced.
That makes the question bigger than whether women reach the C-suite. It is also: Which part of the C-suite do they reach?
And the 50-year wait has become 90
Perhaps the most striking finding is not a representation percentage at all. It is time.
LinkedIn says that, based on the rate of progress during the five years leading up to 2020, the leadership gap was once projected to close in approximately 50 years.
Using the pace recorded since then, the estimate has stretched to around 90 years. That is almost a doubling of the wait.
The estimate should not be treated as a literal prediction that parity will arrive in one specific future year. It is an illustration based on the observed rate of progress. But that is exactly why it is useful. It shows what slowing momentum does.
When progress accelerates, the horizon moves closer. When it stalls, an outcome that already seemed distant recedes further.
90 years is not really a timetable. It is a warning about pace.
The entry-level number changes the diagnosis
If women represented 15% of entry-level workers and 23% of the C-suite, the obvious response would be to increase hiring. But women account for 46% at entry level.
That does not mean every sector, occupation or company begins at 46%. It does mean the aggregate data cannot easily support the idea that the entire leadership gap begins with a lack of women entering work.
Something happens between the first job and the highest one.
- Promotion.
- Role allocation.
- Sponsorship.
- Career interruptions.
- Networks.
- Access to assignments.
- Movement into operating roles.
- Retention.
- Succession.
LinkedIn’s data does not claim that any one of these explains the entire fall. That restraint matters.
What the data establishes is the outcome: women’s representation declines at every step towards the C-suite.
Our earlier analysis of women’s leadership in corporate India reached a similar practical question from a different dataset: if women and ambition are both present, organisations need to examine where progression itself begins to narrow.
Parenting breaks expose one transition particularly clearly
LinkedIn also examined what happens after full-time parenting breaks.
Women are more than 4 times as likely as men to take them. And among senior individual contributors returning from a full-time parenting break, men were 44% more likely than women to be promoted during their first year back.
That does not explain the entire leadership gap. But it shows how one career transition can produce different outcomes.
An organisation can have good maternity policies. Good return rates. Flexible work. And still create a progression problem after the return.
The key measure is therefore not simply: Did she come back?
It is: What happened to her career when she did?
That is why Change in Content has repeatedly argued that return is an event. Career continuity is the outcome.
LinkedIn’s proposed actions are strikingly practical
The data does not end with another general call for organisations to “support women”. LinkedIn points to three areas.
- First, measure where progression slows and put senior-level accountability around the outcome. That means knowing whether women disappear between manager and director, director and VP, VP and C-suite, or particular functions and leadership tracks.
- Second, LinkedIn highlights sponsorship. Not simply mentoring. Senior people actively introducing high-performing women to networks, putting them forward for opportunities, giving them new responsibilities and supporting their advancement.
There is a useful distinction here.
- A mentor can tell someone how to navigate the organisation.
- A sponsor can help change what the organisation lets that person navigate.
- Third, LinkedIn recommends expanding access to STEM, AI and other fast-growing skills. Its analysis says skills-based hiring can increase women’s representation in candidate pools by 24%. That matters because the future leadership pipeline will increasingly be shaped by who is gaining experience in the technologies and businesses growing fastest today.
The next leadership gap may already be forming
LinkedIn’s wider 2026 data gives this question urgency.
Its August research found women accounted for only 26% of US AI hires in 2025, and across 27 countries women held only 13% of C-suite AI leadership roles at AI companies. We examined that separately in our piece on women and the AI jobs boom.
For this article, the relevance is simple. If women are underrepresented today in the roles, skills and businesses likely to create tomorrow’s senior leaders, the existing C-suite gap could reproduce itself in new sectors.
The leadership pipeline is not built when somebody becomes VP. It begins much earlier.
The problem is not that nothing changed
That would be inaccurate too. Women’s representation in top management did rise from 26.7% to 29.6% between 2015 and 2023.
Women now enter employment much closer to parity. And women lead major corporate functions.
Those are real gains. The problem is that improvement has stopped moving quickly enough.
There is an important difference between saying: “Women have made no progress.” and saying: “The progress that was happening has stalled.”
LinkedIn’s numbers support the second statement. That is more precise. And arguably more useful.
Change in Perspective: 46% Was Supposed to Become More Than 23%
There is a temptation to look at entry-level representation and assume time will eventually do the rest.
More women come in. They gain experience. The pipeline matures. Leadership becomes balanced.
LinkedIn’s data shows why that assumption is dangerous.
- Women already account for 46% at entry level.
- Top-management representation has not moved for four years.
- The C-suite remains at 23%.
- And the estimated journey to parity has stretched from 50 years to 90.
Time alone is clearly not doing the work. Companies need to know exactly where women stop moving. Not vaguely. Not across the workforce as a whole.
- At which level?
- In which function?
- After which life event?
- Before which promotion?
- Around which assignments?
That is where the useful work begins.
Because 46% entering should not end with 23% leading. And 90 years is far too long to discover why.
Editorial Note & Sources
This article deliberately relies on LinkedIn Economic Graph findings rather than combining them with external leadership datasets. LinkedIn’s analysis is based on aggregated and anonymised member data across economies included in the World Economic Forum’s Global Gender Gap Report 2026. Its findings represent patterns visible through LinkedIn membership and should not be interpreted as a census of all workers or companies globally. Gender is inferred from first-name information for this analysis; members whose gender could not be inferred are excluded from gender-based calculations. The approximately 90-year parity horizon is an estimate based on the recent rate of progress, not a prediction of a particular parity date.
Sources
LinkedIn Economic Graph: “LinkedIn Data Finds Women Make Up Just 23% of the C-Suite and 28% of Founders”, 16 September 2026. Primary source for entry-level and C-suite representation, the top-management plateau, executive-role differences, the 90-year parity estimate, career-break findings and LinkedIn’s recommended employer actions.
LinkedIn: “New LinkedIn Data Shows Women’s Path to Senior Leadership Is Narrowing”, 5 March 2026. Earlier 2026 LinkedIn Economic Graph research provides additional context on where representation begins to narrow towards senior leadership.
LinkedIn Economic Graph: “Women Account for Just 26% of AI Hires as AI Jobs Surge”, 18 August 2026. Primary LinkedIn source used only for the section on the emerging leadership pipeline in AI roles.
